STORM Webpage
STORM: A Spatio-Temporal Factor Model Based on Dual Vector Quantized Variational Autoencoders for Financial Trading
Accepted by WSDM 2026
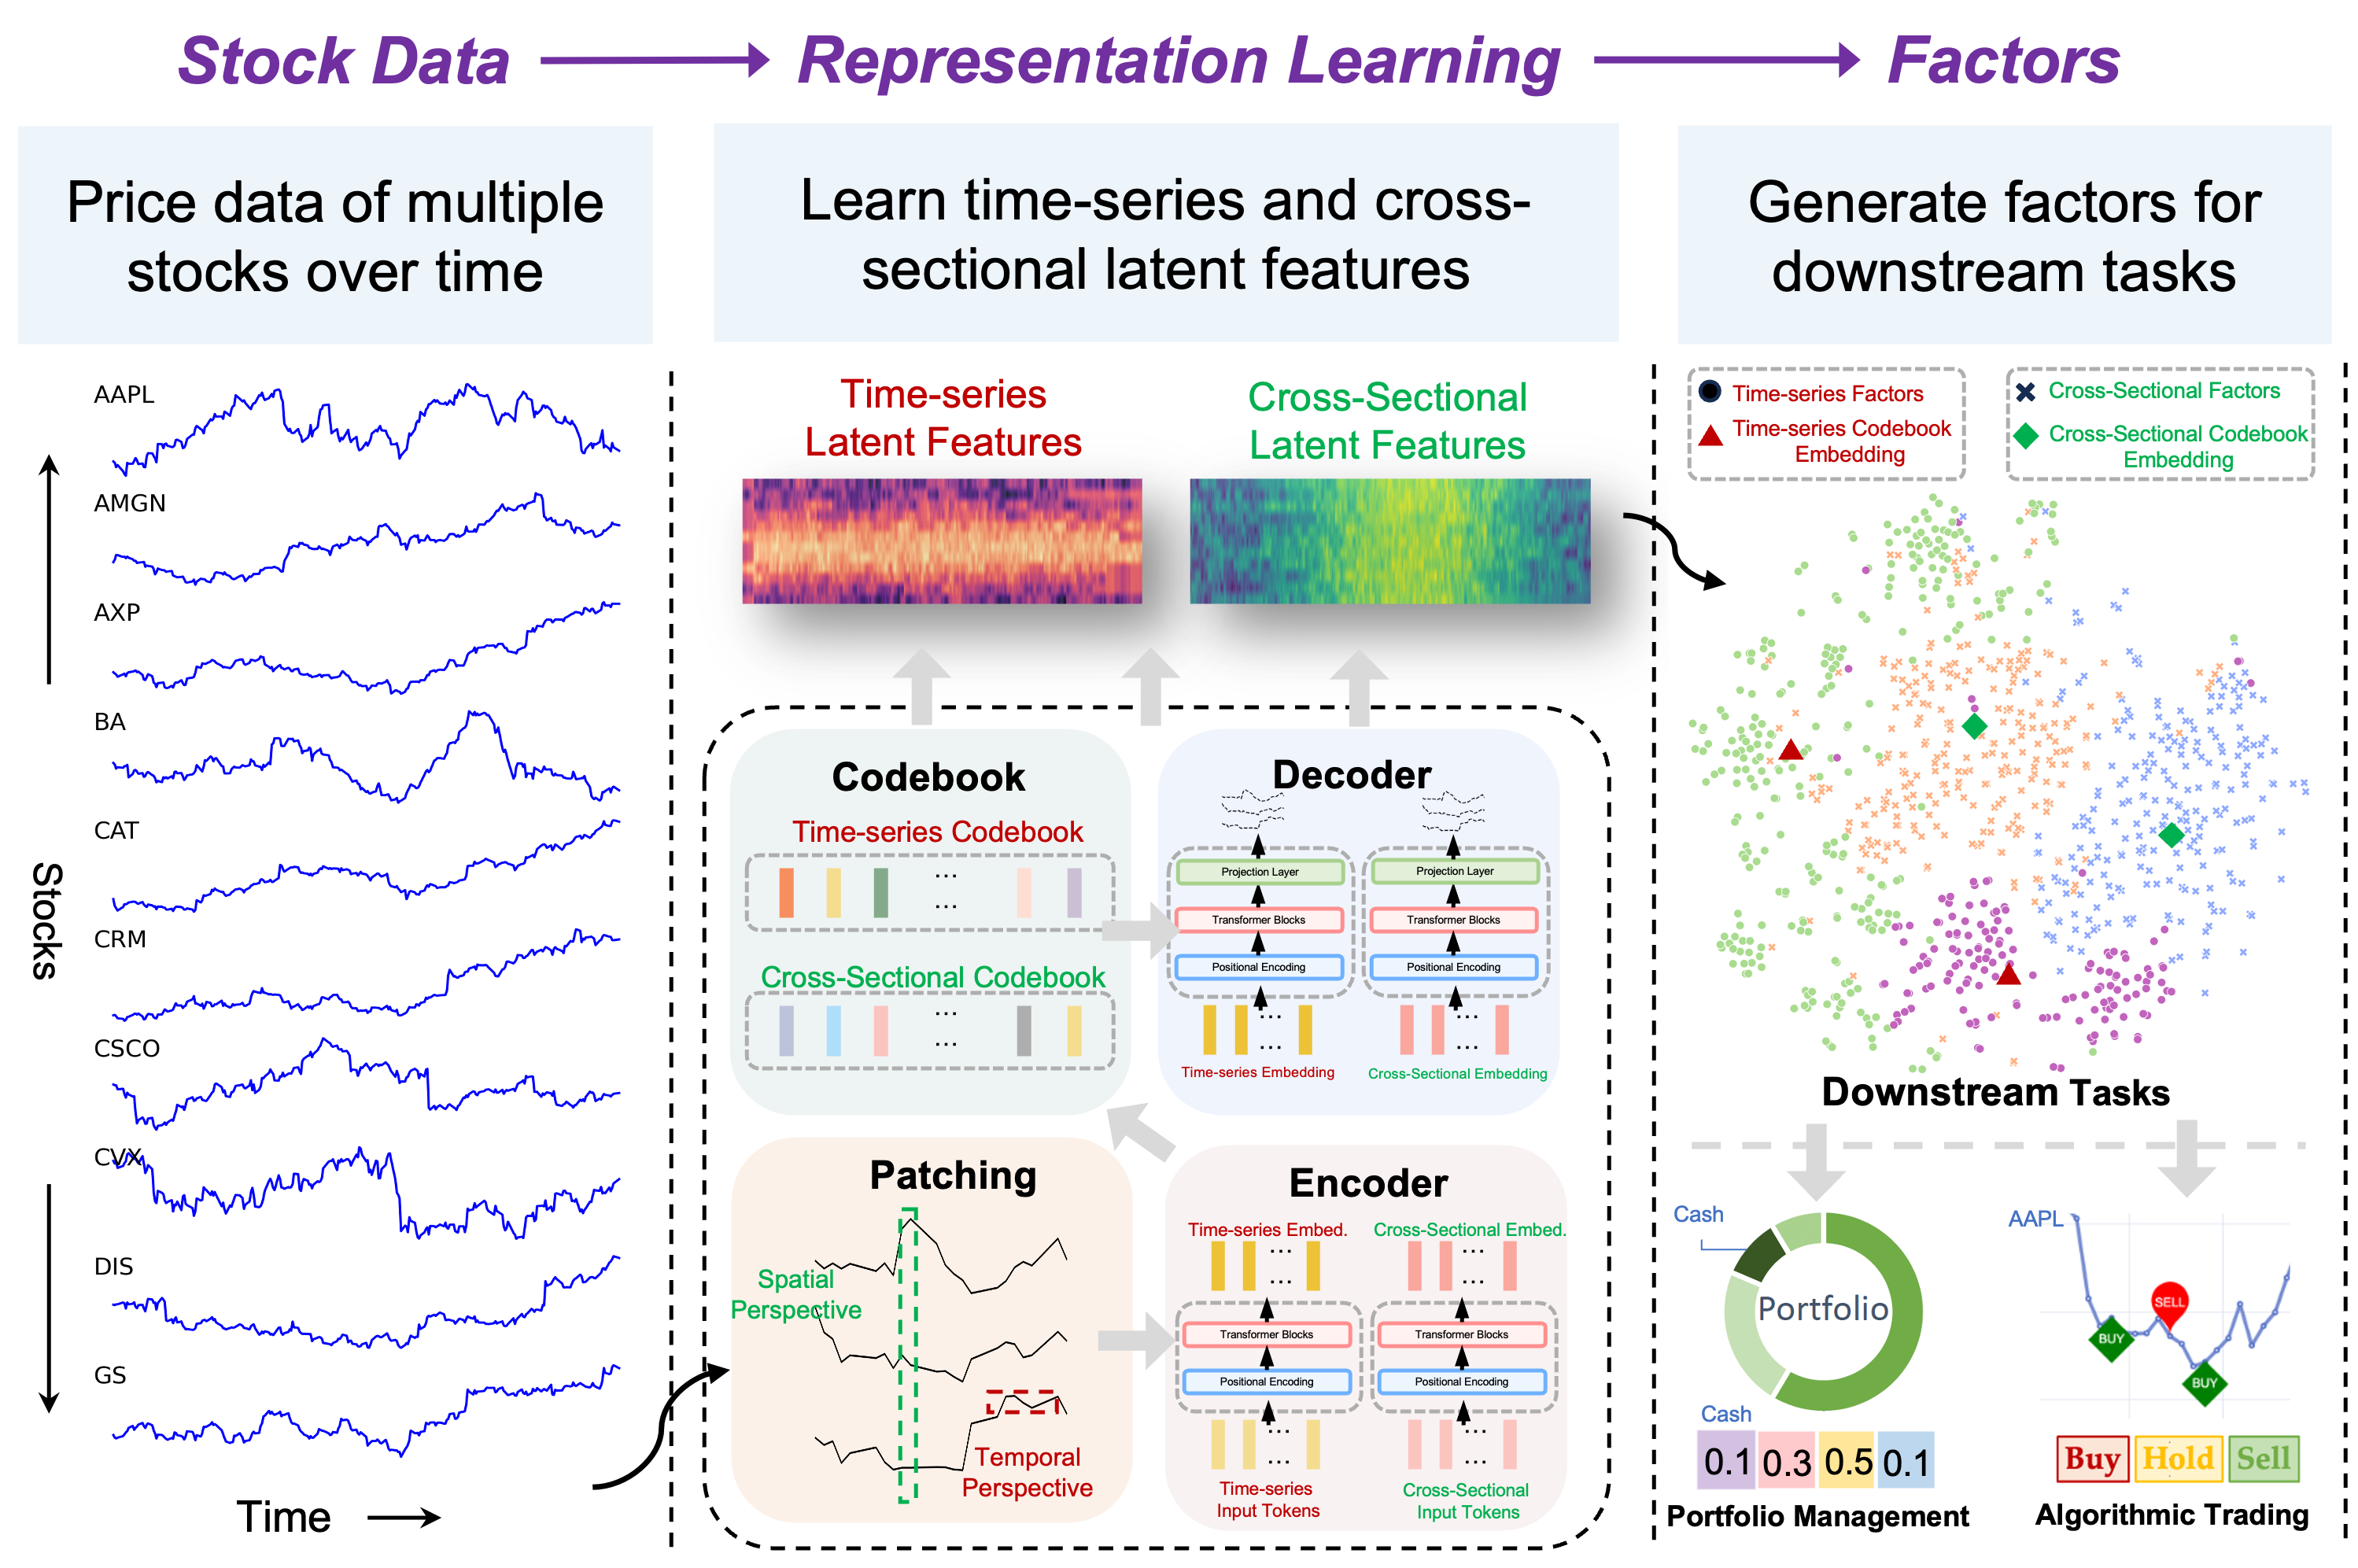
STORM is a Spatio-Temporal factor Model based on dual vector quantized variational autoencoders that extracts stock features from both temporal and spatial perspectives.
The model fuses and aligns these features at a fine-grained semantic level, representing factors as multi-dimensional embeddings rather than single values. By utilizing discrete codebooks to cluster similar factor embeddings, STORM ensures orthogonality and diversity, effectively distinguishing between different factors for financial trading selection.
Extensive experiments in portfolio management and individual trading tasks demonstrate the model's superior performance and flexibility in adapting to downstream financial applications.
Introduction
Recently, we have witnessed the rise of latent factor models, connecting the factor model with the generative model, the variational autoencoder (VAE). These VAE-based models describe high-dimensional data (prices) to low-dimensional representations (factors), and learn factors self-adaptively. Although latent factor models have demonstrated substantial success in financial trading tasks, they still face several significant issues:
CH1: Limited Reflection of Market Complexity
Latent factor models represent factors as single values are inherently constrained by their insufficient capacity to capture the intricate complexity and nonlinearity of financial data, rendering them vulnerable to noise and non-stationarity, which compromises their predictive accuracy and stability.
CH2: Factor Inefficiency
VAE-learned factors suffer from three inefficiencies: i) focusing mainly on cross-sectional factors while neglecting temporal information, ii) allowing noise in continuous latent spaces to overshadow meaningful signals, and iii) lacking independence among factors, which leads to multicollinearity and weak adaptability to varying market conditions.
CH3: Lack of Factor Selection
Existing latent factor models primarily focus on generating factors without adequately differentiating between them. Furthermore, they neglect the crucial process of factor selection, which is essential for identifying impactful factors, thereby limiting the model's overall effectiveness and precision.
In order to address the challenges, we propose a Spatio-Temporal factOR Model based on dual vector quantized variational autoencoders (VQ-VAE), named STORM. Unlike traditional scalar-valued financial factors with clear economic interpretations, STORM learns high-dimensional latent vectors that, while less interpretable capture complexity and nonlinearity inherent in financial martket (CH1). Additionally, we develop a dual VQ-VAE architecture to capture cross-sectional and time-series features, considering both spatial and temporal perspectives. By integrating these features at both fine-grained and semantic levels, the model constructs more effective factors. Through diversity and orthogonality loss constraints, we ensure representation independence among learned representations (CH2). Furthermore, codebook embeddings act as cluster centers, serving as class tokens to categorize factor embeddings. This strategy provides clarity and transparency to the differentiation and selection process of factors (CH3).
Methodology
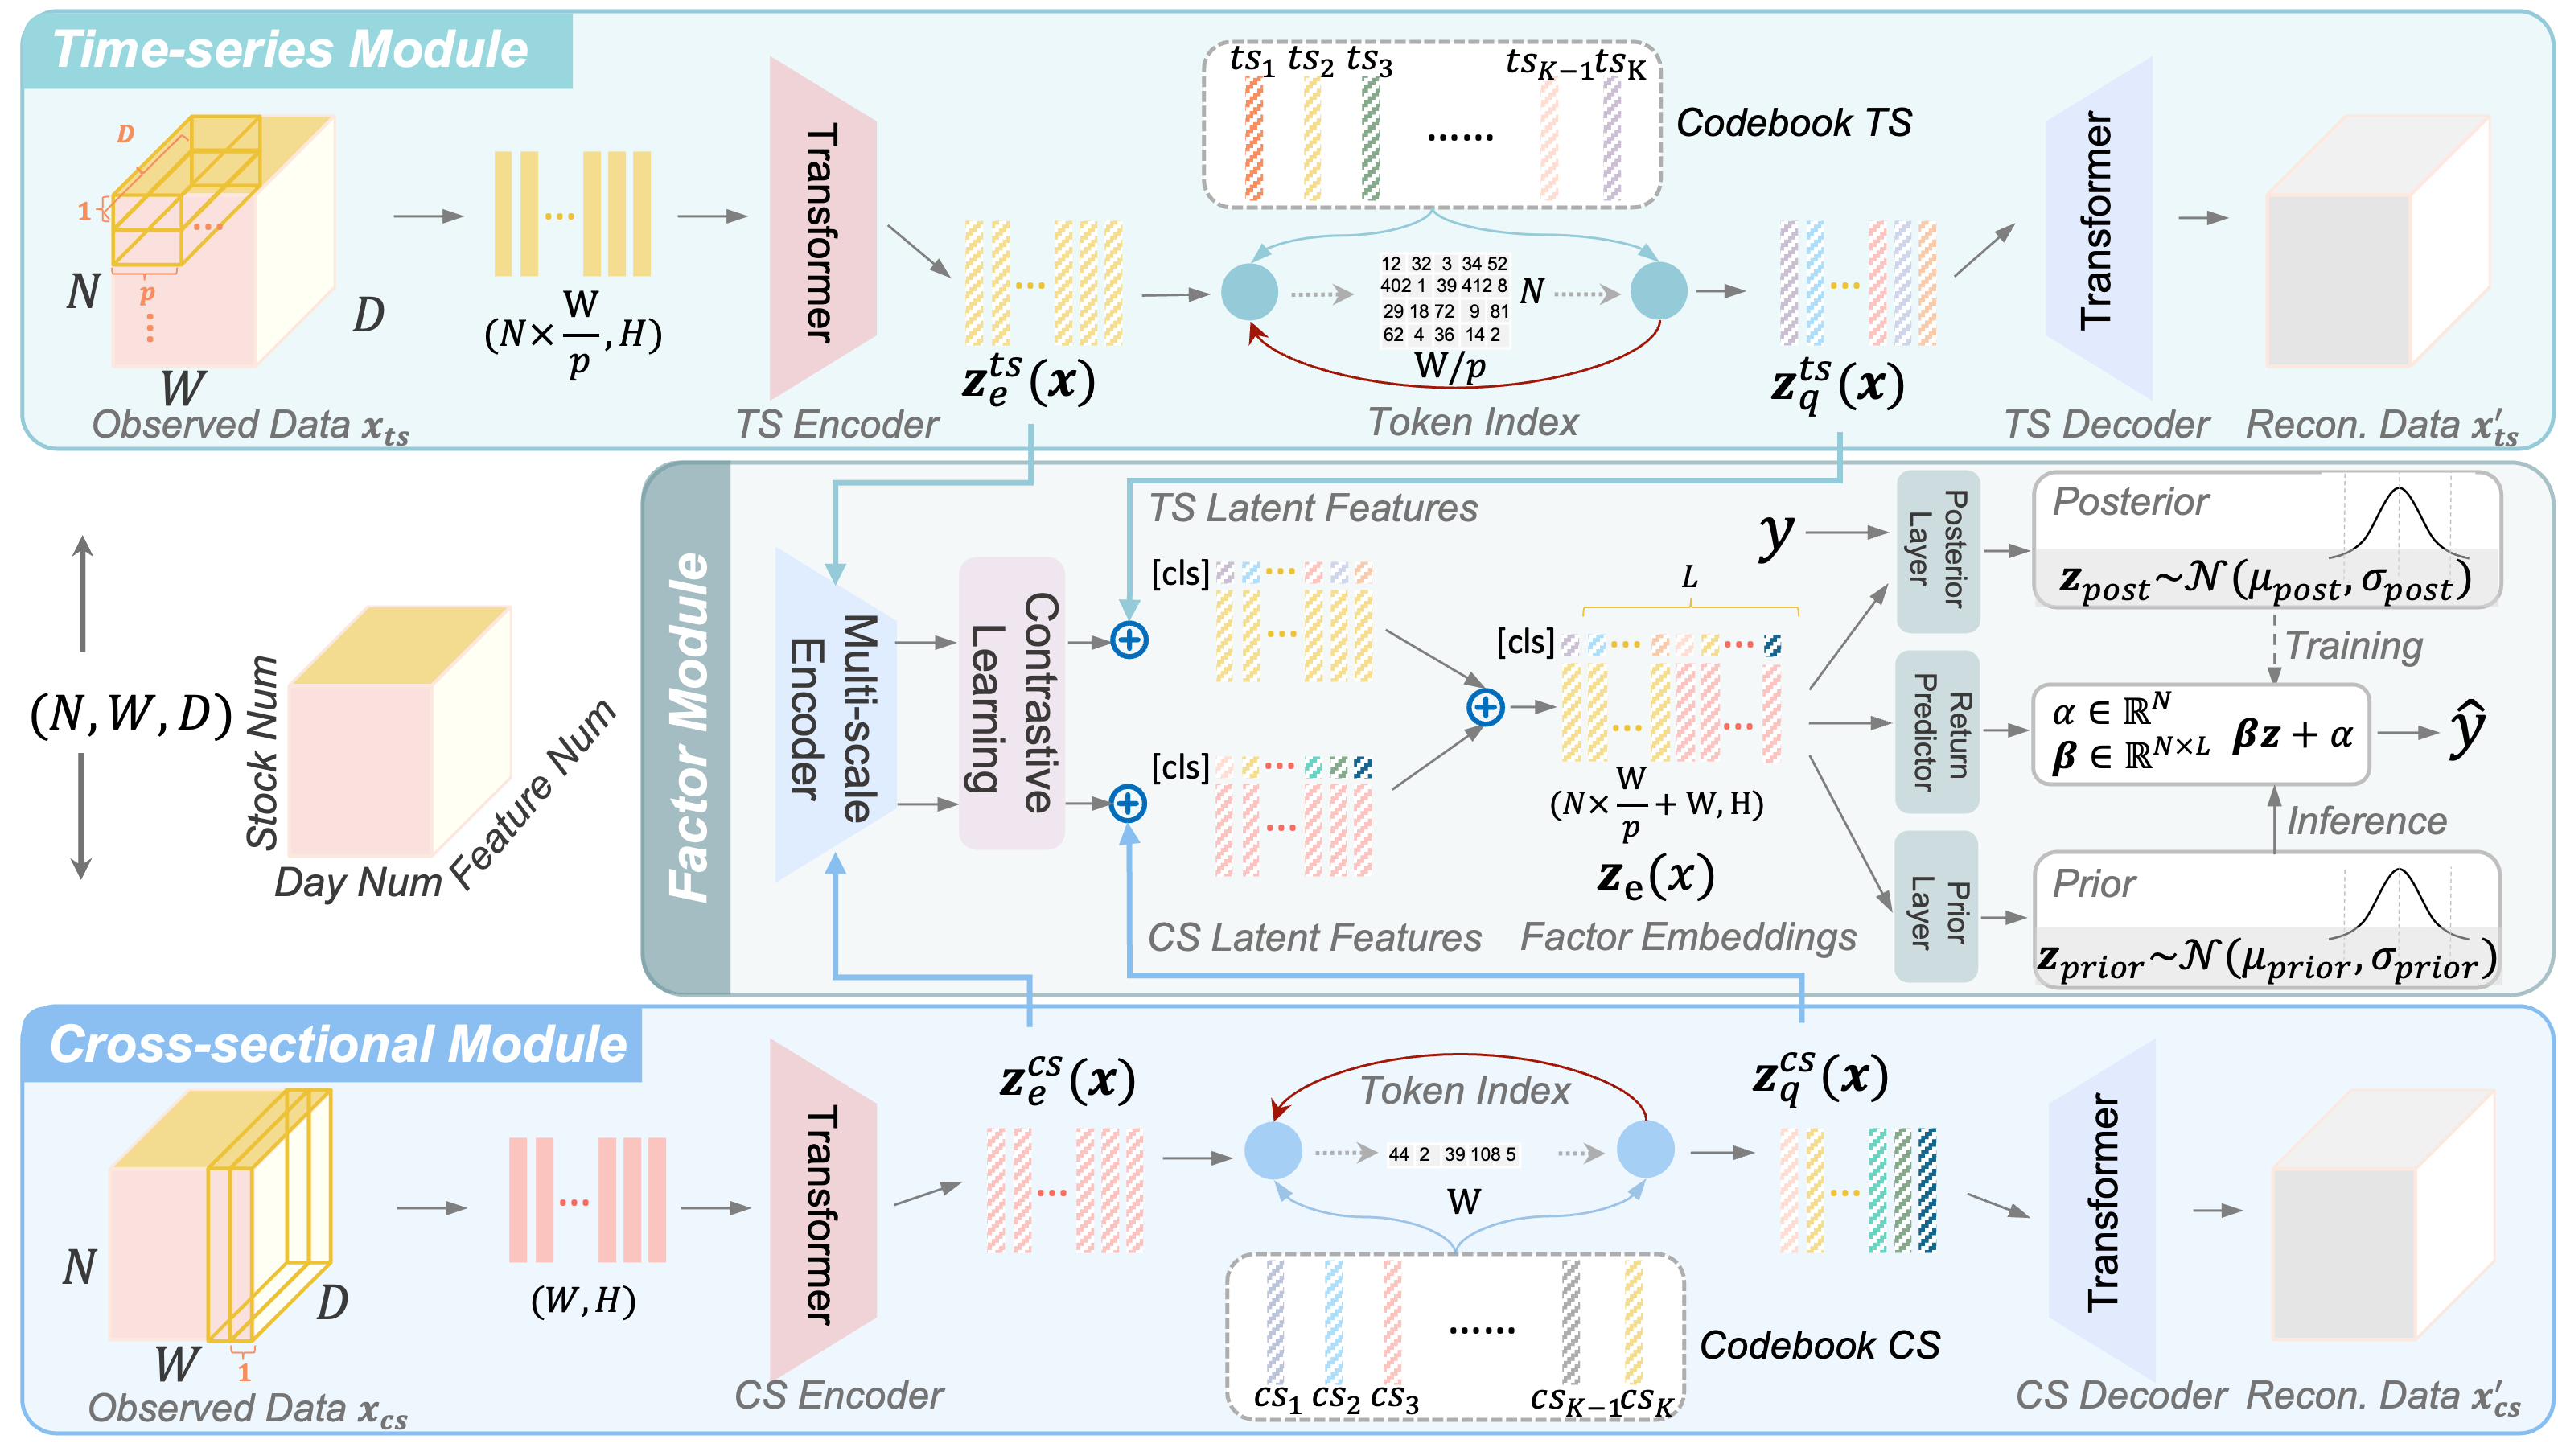
Time-sieres and Cross-sectional Modules
Patching and Encoding: In TS module, observed data is divided along the stock number dimension. In CS module, it’s divided along the time axis. Then we use Transformer as encoders and decoders to capture complex patterns.
Codebook Construction and Optimization:
Diversity loss \( \mathcal{L}_{\text{div}}=\frac{1}{GK}\sum_{g=1}^{G}\sum_{k=1}^{K}\bar{p}_{g,k} \log{\bar{p}_{g,k}} \) is to enhance representational capacity.
Orthogonality loss \( \mathcal{L}_{\text{ortho}}= \frac{1}{K^2}\left|\left| \ell_2(\mathbf{e})^\top \ell_2(\mathbf{e}) - I_K \right|\right|_F^2 \) forces factor orthogonality.
Decoding and Reconstruction: $$ \begin{aligned} \mathcal{L}_1 = & \lambda_{\text{ortho}}\mathcal{L}_{\text{ortho}} + \lambda_{\text{div}}\mathcal{L}_{\text{div}} \\ & + \left\|\mathbf{x}-\mathbf{x}'_{ts}\right\|^2_2 + \left\| \mathbf{x}-\mathbf{x}'_{cs}\right\|^2_2 \\ & + \left\|sg[\mathbf{z}_e^{ts}(\mathbf{x})]-\mathbf{z}_q^{ts}(\mathbf{x})\right\|^2_2 + \left\|sg[\mathbf{z}_q^{ts}(\mathbf{x})]-\mathbf{z}_e^{ts}(\mathbf{x})\right\|^2_2 \\ & + \left\|sg[\mathbf{z}_e^{cs}(\mathbf{x})]-\mathbf{z}_q^{cs}(\mathbf{x})\right\|^2_2 + \left\|sg[\mathbf{z}_q^{cs}(\mathbf{x})]-\mathbf{z}_e^{cs}(\mathbf{x})\right\|^2_2 \end{aligned} $$
Factor Module
Feature Fusion and Alignment: We use multiscale encoder and contrastive learning layer to fuse and align TS and CS features at fine-grained and semantic levels.
Prior - Posterior Learning: Concatenate two latent features, which are used to predict the future returns. The factors are then be used in portfolio and trading downstream tasks.
Method overview
STORM is in a dual VQ-VAE structure, with time-series module, cross-sectional module, and the factor module to align and fuse learned factors.
Downstream Tasks
Portfolio Management: We utilize the factor decoder network to generate stock future returns \( \mathbf{\hat{y}}\), and then apply the TopK-Drop strategy, which constructs a daily portfolio by selecting the top \( k\) stocks based on predicted returns, to backtest the factor model.
Algorithmic Trading: The latent factor embeddings \( \mathbf{Z} \) are integrated into the observation set \( \mathcal{O}=\{\mathbf{Z}, \mathcal{R}\} \), where \( \mathcal{R} \) is the reward function used to guide the agent's learning and decision-making in the environment. We use the Proximal Policy Optimization (PPO) algorithm to optimize the policy.
Experiment Results
Portfolio Management Task
SP500 Dataset
| Strategy | Profit | Risk-Adj. Profit | Risk | |||
|---|---|---|---|---|---|---|
| APY ↑ | CW ↑ | CR ↑ | ASR ↑ | MDD ↓ | AVO ↓ | |
| Market Index | 0.058 | 1.184 | 0.228 | 0.142 | 0.254 | 0.410 |
| LightGBM | 0.059 | 1.201 | 0.304 | 0.332 | 0.238 | 0.176 |
| LSTM | 0.069 | 1.221 | 0.278 | 0.371 | 0.248 | 0.186 |
| Transformer | 0.076 | 1.244 | 0.389 | 0.433 | 0.1981 | 0.174 |
| CAFactor | 0.075 | 1.241 | 0.342 | 0.428 | 0.223 | 0.174 |
| FactorVAE | 0.079 | 1.256 | 0.404 | 0.460 | 0.200 | 0.173 |
| HireVAE | 0.077 | 1.249 | 0.361 | 0.448 | 0.216 | 0.172 |
| STORM | 0.188 | 1.683 | 1.189 | 1.052 | 0.166 | 0.171 |
| ± 0.055 | ± 0.226 | ± 0.661 | ± 0.329 | ± 0.050 | ± 0.020 | |
Table 1: Portfolio management task results of all models across six metrics (mean ± range, computed across 10 runs) on SP500 dataset.
DJ30 dataset
| Strategy | Profit | Risk-Adj. Profit | Risk | |||
|---|---|---|---|---|---|---|
| APY ↑ | CW ↑ | CR ↑ | ASR ↑ | MDD ↓ | AVO ↓ | |
| Market Index | 0.063 | 1.201 | 0.147 | 0.429 | 0.219 | 0.288 |
| LightGBM | 0.069 | 1.221 | 0.288 | 0.430 | 0.244 | 0.160 |
| LSTM | 0.060 | 1.192 | 0.243 | 0.370 | 0.248 | 0.163 |
| Transformer | 0.056 | 1.179 | 0.227 | 0.367 | 0.250 | 0.154 |
| CAFactor | 0.059 | 1.186 | 0.233 | 0.382 | 0.252 | 0.153 |
| FactorVAE | 0.076 | 1.246 | 0.352 | 0.480 | 0.225 | 0.159 |
| HireVAE | 0.072 | 1.233 | 0.298 | 0.445 | 0.247 | 0.163 |
| STORM | 0.148 | 1.517 | 1.396 | 1.052 | 0.108 | 0.140 |
| ± 0.046 | ± 0.188 | ± 0.679 | ± 0.297 | ± 0.026 | ± 0.014 | |
Table 2: Portfolio management task results of all models across six metrics on DJ30 dataset.
Algorithmic Trading Task
| Models | AAPL | JPM | IBM | INTC | MSFT | ||||||||||
|---|---|---|---|---|---|---|---|---|---|---|---|---|---|---|---|
| APY ↑ | CW ↑ | CR ↑ | APY ↑ | CW ↑ | CR ↑ | APY ↑ | CW ↑ | CR ↑ | APY ↑ | CW ↑ | CR ↑ | APY ↑ | CW ↑ | CR ↑ | |
| Buy&Hold | 0.120 | 1.404 | 0.383 | 0.096 | 1.316 | 0.236 | 0.145 | 1.499 | 0.727 | -0.117 | 0.690 | -0.184 | 0.214 | 1.784 | 0.569 |
| LightGBM | 0.135 | 1.390 | 0.487 | 0.116 | 1.335 | 0.333 | 0.227 | 1.654 | 1.091 | -0.042 | 0.880 | 0.038 | 0.267 | 2.068 | 0.637 |
| LSTM | 0.053 | 1.152 | 0.283 | 0.079 | 1.290 | 0.266 | 0.134 | 1.386 | 0.754 | 0.060 | 1.262 | 0.381 | 0.178 | 1.513 | 0.893 |
| Transformer | 0.083 | 1.240 | 0.512 | 0.133 | 1.384 | 0.614 | 0.131 | 1.377 | 0.782 | 0.079 | 1.290 | 0.458 | 0.138 | 1.397 | 0.726 |
| DQN | 0.135 | 1.374 | 0.510 | 0.105 | 1.305 | 0.607 | 0.139 | 1.400 | 0.802 | 0.061 | 1.185 | 0.442 | 0.166 | 1.475 | 0.534 |
| SAC | 0.147 | 1.509 | 0.528 | 0.131 | 1.383 | 0.400 | 0.207 | 1.598 | 1.170 | 0.056 | 1.165 | 0.353 | 0.229 | 1.656 | 0.929 |
| PPO | 0.137 | 1.379 | 0.496 | 0.128 | 1.372 | 0.356 | 0.146 | 1.422 | 0.779 | -0.019 | 0.954 | 0.040 | 0.216 | 1.620 | 0.569 |
| STORM | 0.229 | 1.857 | 0.750 | 0.174 | 1.621 | 0.559 | 0.236 | 1.893 | 1.470 | 0.173 | 1.625 | 0.773 | 0.290 | 2.154 | 1.216 |
| ± 0.033 | ± 0.154 | ± 0.066 | ± 0.032 | ± 0.133 | ± 0.081 | ± 0.039 | ± 0.184 | ± 0.445 | ± 0.067 | ± 0.284 | ± 0.293 | ± 0.052 | ± 0.262 | ± 0.597 | |
| Improvement (%) | 55.782 | 23.062 | 45.076 | 30.827 | 17.124 | 2.117 | 3.965 | 14.4501 | 20.408 | 118.987 | 26.969 | 66.594 | 8.614 | 4.159 | 30.893 |
Table 3: Algorithmic trading task results on all models.
Factor Quality Evaluation Task
| Model | SP500 | DJ30 | ||
|---|---|---|---|---|
| RankIC ↑ | RankICIR ↑ | RankIC ↑ | RankICIR ↑ | |
| LightGBM | 0.027 ± 0.006 | 0.274 ± 0.084 | 0.031 ± 0.005 | 0.272 ± 0.049 |
| LSTM | 0.034 ± 0.006 | 0.333 ± 0.042 | 0.031 ± 0.004 | 0.329 ± 0.056 |
| Transformer | 0.035 ± 0.007 | 0.340 ± 0.078 | 0.033 ± 0.005 | 0.343 ± 0.045 |
| CAFactor | 0.037 ± 0.005 | 0.356 ± 0.084 | 0.040 ± 0.003 | 0.380 ± 0.043 |
| FactorVAE | 0.052 ± 0.010 | 0.543 ± 0.122 | 0.056 ± 0.012 | 0.520 ± 0.081 |
| HireVAE | 0.057 ± 0.006 | 0.558 ± 0.058 | 0.058 ± 0.006 | 0.563 ± 0.053 |
| STORM | 0.062 ± 0.018 | 0.673 ± 0.155 | 0.065 ± 0.038 | 0.668 ± 0.287 |
Table 4: Factor quality evaluation task results on RankIC and RankICIR (mean ± range, computed across 10 runs)
Citation
@inproceedings{zhao2026storm,
title={STORM: A Spatio-Temporal Factor Model Based on Dual Vector Quantized Variational Autoencoders for Financial Trading},
author={Zhao, Yilei and Zhang, Wentao and Yang, Tingran and Jiang, Yong and Huang, Fei and Lim, Wei Yang Bryan},
booktitle={Proceedings of the Nineteenth ACM International Conference on Web Search and Data Mining},
pages={1017--1026},
year={2026}
}